We're thrilled to unveil a game-changing feature that will revolutionize how you analyze data: Granular Insights. With this latest update, you can dive deeper into your dashboard metrics like never before!
👀 What’s New?
-
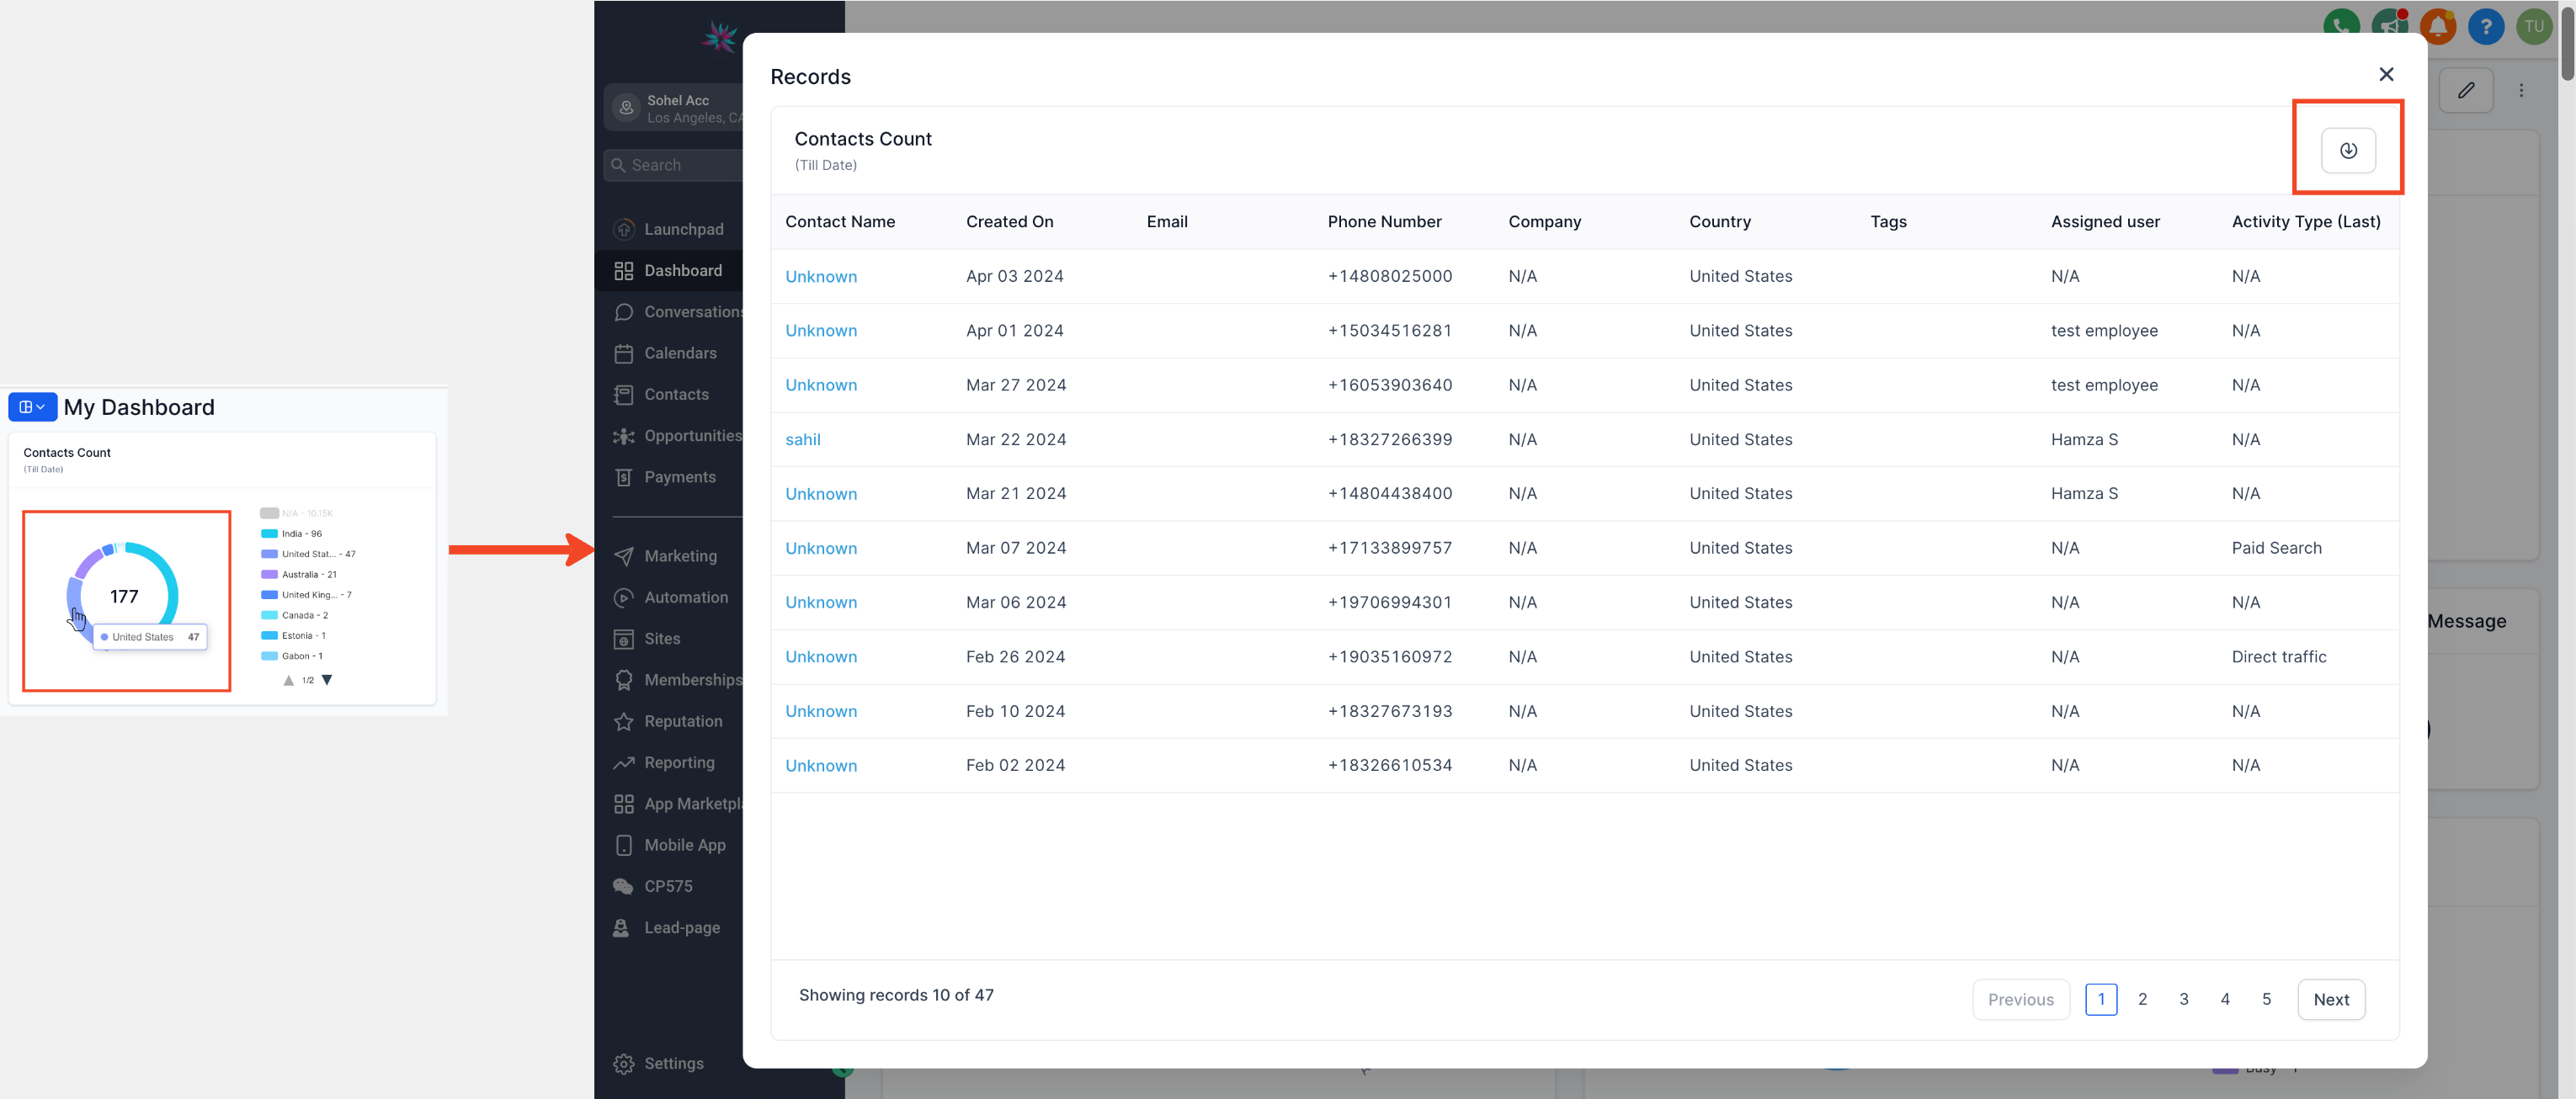
Clickable Graphs: Now, every widget on your dashboard becomes an interactive gateway to deeper insights. Simply click on any component of the widget, whether it's a node on a line graph or a bar in a bar graph, to unlock a treasure trove of data.
-
Record View: Get a closer look at the records behind the metrics with an intuitive table view. See important fields and parameters at a glance, empowering you to make informed decisions.
-
CSV Export: Need to take your analysis to the next level? No problem! With just a click, export your records as a CSV file. This is available for Table widgets as well.
👷 How It Works:
- Navigate to Your Dashboard
- Click on any widget node or component.
- Explore the table list of records, complete with essential fields and parameters.
- Click to export your records as a CSV file for further analysis. (Optional)
⭐ Why it Matters:
-
Streamlined Analysis: Say goodbye to guesswork! With clickable graphs and record views, you'll gain unparalleled clarity into your data, enabling smarter, data-driven decisions.
-
Enhanced Efficiency: No more jumping through hoops to extract crucial information. With Granular Insights, accessing and analyzing your data is faster and more intuitive than ever before.
📌 Imp Note: Do not switch the tab or close the tab while an export is ongoing. Granular Insights does not support third party dependant widgets (FB and Google)